The code in this article was written using Code::Blocks and SDL 2.
You can read
here a guide to install this software.
Although it is based on SDL, I don't use its functions directly. I have written a small library with a few basic
functions to ease the understanding and the portability to another language.
You can read more about this lib
here.
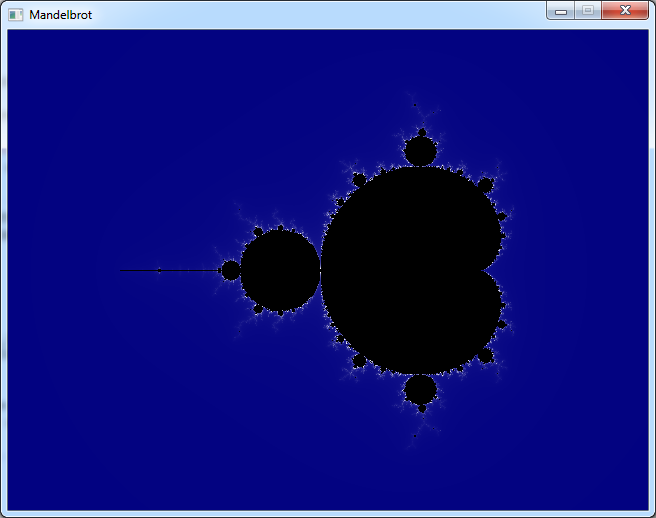
The Mandelbrot set is a famous mathematical object that you probably already saw.
Apart from its aesthetic qualities it's a graphical representation of some properties of numbers that have a deep
meaning in various branches of mathematics.
It is probably the most popular fractal. And we can see inside it a great variety of shapes.
At full scale we can clearly see the self-similarity of the circular shapes and the lightning-like branches.
If you zoom on a part of it you will discover spirals and lace-like patterns.
There are good softwares designed to explore this set in depth. Here I will only explain a small program to draw it
at full scale and a few tricks to make it quicker and nicer.
Although it looks like it's a complex shape the Mandelbrot set is not so difficult to draw. It only requires a little
bit of arithmetic.
To draw the Mandelbrot set, you need to know what a complex number is.
Complex numbers were first invented in the 16th century to solve polynomial equations.
They are commonly named "z" and look like this:
z = a + b*i
a and b are real numbers.
i is called the imaginary unit. The only thing we need to know about it is that:
i2 = -1
As you know, the square of a number is always positive. So a number like i should not exist but it turns out that
if we accept that such a number exists, we can solve some hard equations.
In the number z, "a" is called the real part and "b*i" is the imaginary part.
Now we will need to understand two operations that we can perform on these numbers: the addition and the
multiplication.
So let's assume that we have 2 complex numbers:
		z1 = a1 + b1*i
		z2 = a2 + b2*i
When we add them
z1 + z2 = a1 + b1*i + a2 + b2*i
if we group together the real and the imaginary terms
z1 + z2 = (a1 + a2) + (b1 + b2)*i
We get a new complex number which real part is (a
1+a
2) and which imaginary part is (b
1+b
2)*i
Now let's multiply them:
		z1 * z2 = (a1 + b1*i) * (a2 + b2*i)
		        = a1*a2 + a1*b2*i + b1*a2*i + b1*b2*i2
But i
2 = -1. So we get:
z1 * z2 = (a1*a2 - b1*b2) + (a1*b2 + b1*a2)*i
Again we get a complex number with a real and an imaginary parts.
And specifically if we multiply a number by itself we have:
z2 = (a2 - b2) + (2*a*b)*i
Now let's think about another way to view the complex numbers.
We said that a complex number contains 2 reals numbers - one in the real part and one in the imaginary part.
If we consider these 2 real numbers as coordinates we could represent the complex number on the screen.
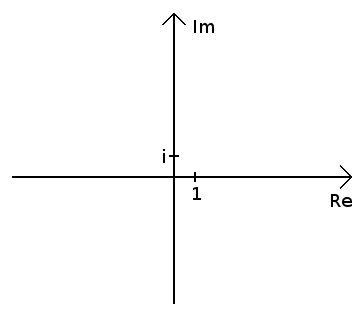
First we will think about a coordinates system to locate our numbers.
Let's say that we have a horizontal axis for the real part of the number. One unit along this axis represents the
real number 1.
The vertical axis will be for the imaginary part. One unit along this axis would be i.
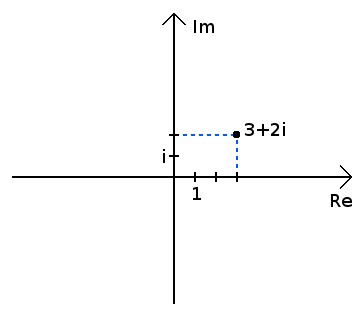
So each complex number would apppear as a point in this coordinates system.
In example the number 3 + 2*i would look like this.
Now imagine that our screen represents a limited part of this plane.
Let's say in example that it is centered around the origin an that it spread from -2 to 2 along both axes.
For each pixel of our screen, we can retrieve the corresponding coordinates of the plane and that gives us a
complex number.
The idea to draw the Mandelbrot set is to loop through every pixel of the screen and to set its color based on a
calculation done on the corresponding complex number.
Let's call c the complex number associated to our pixel.
We will compute the successive values of the function defined by:
		z0 = 0
		zn+1 = zn2 + c
where the values of z are complex numbers.
We will do that until z gets too big or until n reach a maximum value n
max.
Then we will set the color of the pixel depending on the number of iterations "n" we reached at the moment z got
out of bound.
Or we'll set it black if we reached n
max and z never got too big.
But what does it mean "getting too big" for a complex number ?
Well, as we can represent a complex number as a point on the plane, we will define it's "magnitude" as the
distance from this point to the origin.
So, if z = a + b*i, by applying the Pythagoras' theorem it's magnitude is √(a
2+b
2).
As we only check if the magnitude gets greater than a given value we can get rid of the square root and check if
(a
2+b
2) is greater than say 16.
Here is a quick example. Let's say that c = 2 + 2*i. We will compute:
		z0 = 0
		z1 = 02 + (2 + 2*i) = 2 + 2*i
		z2 = (2 + 2*i)2 + (2 + 2*i)
		...
And so on, until z gets too big or we reach the n
max-th term.
As we will use n for the color, setting n
max to 256 will be convenient.
So here is our first program
		#include <stdio.h>
		#include <stdlib.h>
		#include <math.h>
		#include "main.h"
		#include "Graphics.h"
		#include "System.h"

		#define SCREEN_WIDTH    640
		#define SCREEN_HEIGHT   480
		#define MAX_ITERATIONS  256

		int main(int argc, char* argv[])
		{
			// init the window
			gfx.init("Mandelbrot", SCREEN_WIDTH, SCREEN_HEIGHT);
			gfx.init2D();
			gfx.clearScreen(Color(0, 0, 0, SDL_ALPHA_OPAQUE));

			for (int y = 0; y < SCREEN_HEIGHT; y++)
				for (int x = 0; x < SCREEN_WIDTH; x++)
				{
					// convert the pixel pos to a complex number
					double c_re = (x - SCREEN_WIDTH  / 2.0) * 4.0 / SCREEN_WIDTH - 0.7;
					double c_im = (y - SCREEN_HEIGHT / 2.0) * 4.0 / SCREEN_WIDTH;

					double z_re = 0;
					double z_im = 0;
					int iteration = 0;

					while (z_re * z_re + z_im * z_im <= 16 &&
					       iteration < MAX_ITERATIONS)
					{
						// compute the new value
						double zn_re = z_re * z_re - z_im * z_im + c_re;
						double zn_im = 2 * z_re * z_im + c_im;

						// copy back the result to z
						z_re = zn_re;
						z_im = zn_im;

						iteration++;
					}

					// draw the pixel
					Color col;

					if (iteration == MAX_ITERATIONS)
						col = Color(0, 0, 0);
					else
						col = Color(iteration, iteration, iteration/2 + 128);

					gfx.setPixel(x, y, col);

					// display and process the events
					gfx.render();
					sys.processEvents();
					if (sys.isQuitRequested() == true)
						exit(EXIT_SUCCESS);
				}

			// wait until we quit
			while (sys.isQuitRequested() == false)
			{
				sys.processEvents();
				sys.wait(50);
			}

			gfx.quit();

			return EXIT_SUCCESS;
		}

		Download source code
		Download executable for Windows
Notice that at each pixel we call gfx.render() because I wanted to make an animation and see how the program works.
But it turns out to be a little bit slow.
The result of this program is the image at the beginning of this article.
Drawing following a pattern
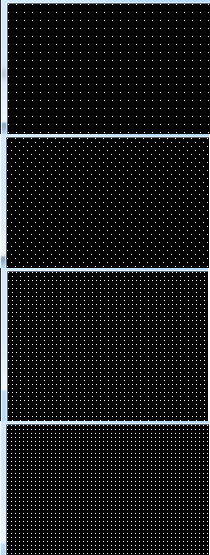
To speed up the drawing I wanted to change the order of the pixels we draw.
We will draw only 1 pixel over 8 along x and y then we will repeat that but with a different starting point.
In a way that we fill uniformely the screen following a dithering pattern.
Here are the pixels that will be drawn in the first 4 steps.
This way we can see the outline of the set very early then the details appear little by little.
First we need to modify our Mandelbrot drawing so that it only draws 1 pixel over 8
		void drawMandelbrot(int offsetx, int offsety)
		{
			for (int y = 0; y < SCREEN_HEIGHT; y += 8)
			{
				for (int x = 0; x < SCREEN_WIDTH; x += 8)
				{
					// convert the pixel pos to a complex number
					double c_re = (x + offsetx - SCREEN_WIDTH  / 2.0) * 4.0 / SCREEN_WIDTH - 0.7;
					double c_im = (y + offsety - SCREEN_HEIGHT / 2.0) * 4.0 / SCREEN_WIDTH;

					double z_re = 0;
					double z_im = 0;
					int iteration = 0;

					while (z_re * z_re + z_im * z_im <= 16 &&
					       iteration < MAX_ITERATIONS)
					{
						// compute the new value
						double zn_re = z_re * z_re - z_im * z_im + c_re;
						double zn_im = 2 * z_re * z_im + c_im;

						// copy back the result to z
						z_re = zn_re;
						z_im = zn_im;

						iteration++;
					}

					// draw the pixel
					Color col;

					if (iteration == MAX_ITERATIONS)
						col = Color(0, 0, 0);
					else
						col = Color(iteration, iteration, iteration/2 + 128);

					gfx.setPixel(x + offsetx, y + offsety, col);
				}
			}
		}
Then the main code calls this function with an offset coming from a table.
This table is a Bayer matrix used in ordered dithering. I will probably write another article about that one day.
		int main(int argc, char* argv[])
		{
			// init the window
			gfx.init("Mandelbrot 2", SCREEN_WIDTH, SCREEN_HEIGHT);
			gfx.init2D();
			gfx.clearScreen(Color(0, 0, 0, SDL_ALPHA_OPAQUE));

			static Uint8 pattern[64] =
			{
				 0, 32,  8, 40,  2, 34, 10, 42,
				48, 16, 56, 24, 50, 18, 58, 26,
				12, 44,  4, 36, 14, 46,  6, 38,
				60, 28, 52, 20, 62, 30, 54, 22,
				 3, 35, 11, 43,  1, 33,  9, 41,
				51, 19, 59, 27, 49, 17, 57, 25,
				15, 47,  7, 39, 13, 45,  5, 37,
				63, 31, 55, 23, 61, 29, 53, 21
			};

			for (int i = 0; i < 64; i++)
			{
				int j = 0;
				while (pattern[j] != i)
					j++;

				drawMandelbrot(j % 8, j / 8);

				// display and process the events
				gfx.render();
				sys.wait(50);
				sys.processEvents();
				if (sys.isQuitRequested() == true)
					exit(EXIT_SUCCESS);
			}

			// wait until we quit
			while (sys.isQuitRequested() == false)
			{
				sys.processEvents();
				sys.wait(50);
			}

			gfx.quit();

			return EXIT_SUCCESS;
		}

		Download source code
		Download executable for Windows
Then I made a class for the complex numbers.
		class Complex
		{
		public:
			Complex(double _re = 0.0, double _im = 0.0);

			double  squareMag();
			double  mag();

			void    operator=(const Complex rhs);
			Complex operator+(const Complex rhs);
			Complex operator*(const Complex rhs);

			double re;
			double im;
		};
That greatly simplifies the drawing function.
		void drawMandelbrot(int offsetx, int offsety)
		{
			for (int y = 0; y < SCREEN_HEIGHT; y += 8)
			{
				for (int x = 0; x < SCREEN_WIDTH; x += 8)
				{
					// convert the pixel pos to a complex number
					Complex c;
					c.re = (x + offsetx - SCREEN_WIDTH  / 2.0) * 4.0 / SCREEN_WIDTH - 0.7;
					c.im = (y + offsety - SCREEN_HEIGHT / 2.0) * 4.0 / SCREEN_WIDTH;

					Complex z;
					int iteration = 0;

					while (z.squareMag() <= 16 &&
					       iteration < MAX_ITERATIONS)
					{
						// compute the new value
						z = z * z + c;

						iteration++;
					}

					// draw the pixel
					Color col;

					if (iteration == MAX_ITERATIONS)
						col = Color(0, 0, 0);
					else
						col = Color(iteration, iteration, iteration/2 + 128);

					gfx.setPixel(x + offsetx, y + offsety, col);
				}
			}
		}

		Download source code
		Download executable for Windows
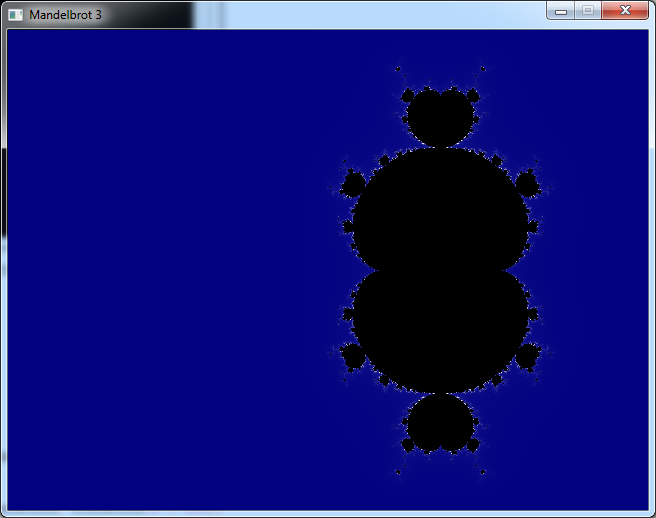
And now you can easily change the formula. In example here is what z
n+1 = z
n3 + c gives:
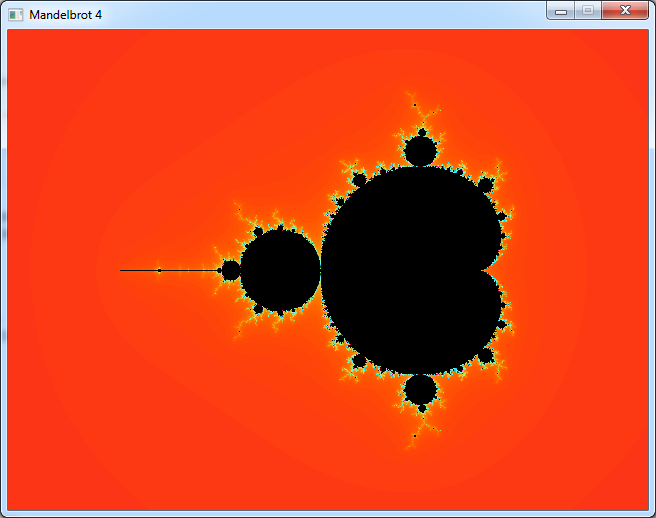
Until now I set the color of the pixel using a simple formula to get a gradient from blue to white.
But with the right colors you can see a lot more details in the Mandelbrot set.
As in our case n
max = 256, we will use a 256 colors palette.
There are a lot of techniques to compute this palette. It turns out that to get the most details the colors should
not follow a linear distribution.
I didn't want to do a too complex thing. I only played with sines to get a more colorful palette.
		// set up the palette
		for (int i = 0; i < 256; ++i)
		{
			float angle = 2.0 * M_PI * (float)i / 256.0;
			float offset = 2.0 * M_PI / 3.0;
			angle += 40.0 *  M_PI / 128.0;
			angle *= 1.3;

			palette[i].r = 128 + 128 * sin(angle);
			palette[i].g = 128 + 128 * sin(angle * 1.1 - offset);
			palette[i].b = 128 + 128 * sin(angle * 1.5 + offset);
		}

		Download source code
		Download executable for Windows
And this is what it looks like.
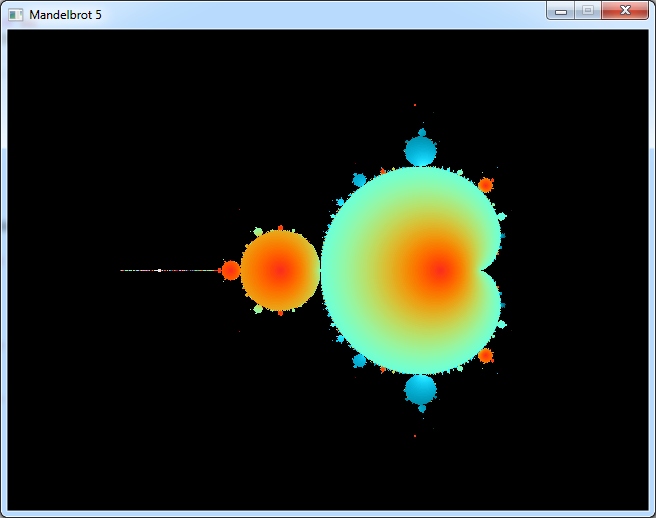
Every time you see a picture of the Mandelbrot set, only the outside is coloured. The inside stays black.
I wanted to see what is hidden in this black part.
But we set the color of the pixels depending on the number of iterations.
And the pixels of the inside have all reached the max iteration n
max.
So we will colour them depending on the magnitude of z we reached after these iterations.
		// draw the pixel
		Color   col;

		if (iteration == MAX_ITERATIONS)
		{
			int v = (int)(z.mag() * 128.0) % 256;
			col = palette[v];
		}
		else
		{
			col = Color(0, 0, 0);
		}

		gfx.setPixel(x + offsetx, y + offsety, col);

		Download source code
		Download executable for Windows
And this is what the inside looks like.
 Video: Mandelbrot set in p5.js